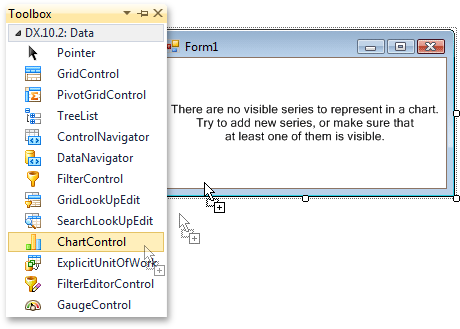
下面的示例演示了如何把 ChartControl 添加到窗体中。 注意,不能同时在设计时刻和运行时刻把图表控件添加到图表应用程序。
-
设计时刻 。
在默认情况下,ChartControl 项被添加到 VS IDE 的 DX.10.2: Data 工具箱标签页中。 因此,要把图表控件添加到项目中,只需要把相应的工具箱项拖放到窗体上。
 注意
注意当添加 ChartControl 时,图表向导窗口可能会被调用 (如果启用了向导的“Display a wizard every time a new chart is added[当添加新图表时显示向导]”选项)。 如果不需要使用向导,或者不需要执行所有步骤来定制图表的初始外观,就单击 取消(Cancel) 按钮。
-
运行时刻 。
要在运行时刻把图表控件添加到窗体上,则不要忘了把所有 必需的程序集 添加到项目的“引用”列表中。
| C# |  复制代码 复制代码 |
|---|---|
using System.Drawing; using System.Windows.Forms; using DevExpress.XtraCharts; // ... private void OnButtonClick(object sender, System.EventArgs e) { // Create a new Chart control. ChartControl chart = new ChartControl(); // Set the chart's location. chart.Location = new Point(10, 10); // Perform any other initialization here. // ... // ... // Add the chart to the Form. this.Controls.AddRange(new Control[] {chart}); } | |
| Visual Basic |  复制代码 复制代码 |
|---|---|
Imports System.Drawing Imports System.Windows.Forms Imports DevExpress.XtraCharts ' ... Private Sub OnButtonClick(sender As Object, e As System.EventArgs) _ Handles Button1.Click ' Create a new Chart control. Dim chart As New ChartControl() ' Set the chart's location. chart.Location = New Point(10, 10) ' Perform any other initialization here. ' ... ' ... ' Add the chart to the Form. Me.Controls.AddRange(New Control() {chart}) End Sub | |


