 Show Me Show Me |
|---|
在 DevExpress Code Central 数据库中可以找到完整的示例项目,网址是 http://www.devexpress.com/example=E1245。 取决于目标平台类型 (ASP.NET、WinForms 等),可以在线运行本示例,或者下载自动可执行的示例。 |
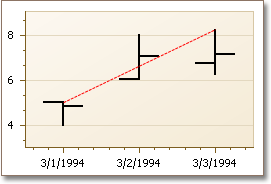
本示例演示了在运行时刻如何把 趋势线 添加到系列的 指标线 集合中。
| C# |  复制代码 复制代码 |
|---|---|
(Form1.cs) using System; using System.Drawing; using System.Windows.Forms; using DevExpress.XtraCharts; // ... private void Form1_Load(object sender, EventArgs e) { // Create an empty chart. ChartControl stockChart = new ChartControl(); // Create a stock series, add it to the chart and set its properties. Series series1 = new Series("Series 1", ViewType.Stock); stockChart.Series.Add(series1); series1.ArgumentScaleType = ScaleType.DateTime; series1.ValueScaleType = ScaleType.Numerical; // Add points to the series. series1.Points.Add(new SeriesPoint(new DateTime(1994, 3, 1), new object[] { 4.00, 5.00, 5.00, 4.85 })); series1.Points.Add(new SeriesPoint(new DateTime(1994, 3, 2), new object[] { 6.05, 8.05, 6.05, 7.05 })); series1.Points.Add(new SeriesPoint(new DateTime(1994, 3, 3), new object[] { 6.25, 8.25, 6.75, 7.15 })); // Create and customize a trendline, TrendLine trendline1 = new TrendLine("A Trend"); trendline1.Point1.Argument = new DateTime(1994, 3, 1); trendline1.Point1.ValueLevel = ValueLevel.High; trendline1.Point2.Argument = new DateTime(1994, 3, 3); trendline1.Point2.ValueLevel = ValueLevel.High; trendline1.ExtrapolateToInfinity = false; trendline1.Color = Color.Red; trendline1.LineStyle.DashStyle = DashStyle.Dash; // Cast the view type of the series to the Stock view. StockSeriesView myView = ((StockSeriesView)series1.View); // Define the Y-axis range. myView.AxisY.Range.AlwaysShowZeroLevel = false; // Add the trendline to the series collection of indicators. myView.Indicators.Add(trendline1); // Add the chart to the form. stockChart.Dock = DockStyle.Fill; this.Controls.Add(stockChart); } | |
| Visual Basic |  复制代码 复制代码 |
|---|---|
(Form1.vb) Imports System Imports System.Drawing Imports System.Windows.Forms Imports DevExpress.XtraCharts ' ... Private Sub Form1_Load(ByVal sender As Object, _ ByVal e As EventArgs) Handles MyBase.Load ' Create an empty chart. Dim stockChart As New ChartControl() ' Create a stock series, add it to the chart and set its properties. Dim series1 As New Series("Series 1", ViewType.Stock) stockChart.Series.Add(series1) series1.ArgumentScaleType = ScaleType.DateTime series1.ValueScaleType = ScaleType.Numerical ' Add points to the series. series1.Points.Add(New SeriesPoint(New DateTime(1994, 3, 1), _ New Object() { 4.00, 5.00, 5.00, 4.85 })) series1.Points.Add(New SeriesPoint(New DateTime(1994, 3, 2), _ New Object() { 6.05, 8.05, 6.05, 7.05 })) series1.Points.Add(New SeriesPoint(New DateTime(1994, 3, 3), _ New Object() { 6.25, 8.25, 6.75, 7.15 })) ' Create and customize a trendline, Dim trendline1 As New TrendLine("A Trend") trendline1.Point1.Argument = New DateTime(1994, 3, 1) trendline1.Point1.ValueLevel = ValueLevel.High trendline1.Point2.Argument = New DateTime(1994, 3, 3) trendline1.Point2.ValueLevel = ValueLevel.High trendline1.ExtrapolateToInfinity = False trendline1.Color = Color.Red trendline1.LineStyle.DashStyle = DashStyle.Dash ' Cast the view type of the series to the Stock view. Dim myView As StockSeriesView = (CType(series1.View, StockSeriesView)) ' Define the Y-axis range. myView.AxisY.Range.AlwaysShowZeroLevel = False ' Add the trendline to the series collection of indicators. myView.Indicators.Add(trendline1) ' Add the chart to the form. stockChart.Dock = DockStyle.Fill Me.Controls.Add(stockChart) End Sub | |
在下面的插图中显示了结果。

 Show Me Show Me |
|---|
在 DevExpress Code Central 数据库中可以找到完整的示例项目,网址是 http://www.devexpress.com/example=E1245。 取决于目标平台类型 (ASP.NET、WinForms 等),可以在线运行本示例,或者下载自动可执行的示例。 |


