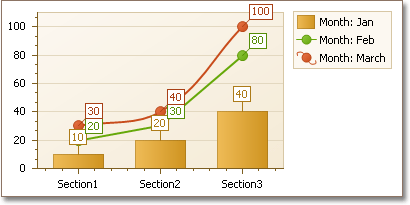
本示例演示了在运行时刻如何访问 自动创建的系列 (根据系列模板设置自动生成的系列),从而个别改变其 视图类型。
这是在图表的 BoundDataChanged 特殊事件中完成的。
| C# |  复制代码 复制代码 |
|---|---|
using System; using System.Data; using System.Windows.Forms; using DevExpress.XtraCharts; // ... private DataTable CreateChartData() { // Create an empty table. DataTable table = new DataTable("Table1"); // Add three columns to the table. table.Columns.Add("Month", typeof(String)); table.Columns.Add("Section", typeof(String)); table.Columns.Add("Value", typeof(Int32)); // Add data rows to the table. table.Rows.Add(new object[] { "Jan", "Section1", 10 }); table.Rows.Add(new object[] { "Jan", "Section2", 20 }); table.Rows.Add(new object[] { "Jan", "Section3", 40 }); table.Rows.Add(new object[] { "Feb", "Section1", 20 }); table.Rows.Add(new object[] { "Feb", "Section2", 30 }); table.Rows.Add(new object[] { "Feb", "Section3", 80 }); table.Rows.Add(new object[] { "March", "Section1", 30 }); table.Rows.Add(new object[] { "March", "Section2", 40 }); table.Rows.Add(new object[] { "March", "Section3", 100 }); return table; } private void Form1_Load(object sender, EventArgs e) { // Create a chart. ChartControl chart = new ChartControl(); // Generate a data table and bind the chart to it. chart.DataSource = CreateChartData(); // Specify data members to bind the chart's series template. chart.SeriesDataMember = "Month"; chart.SeriesTemplate.ArgumentDataMember = "Section"; chart.SeriesTemplate.ValueDataMembers.AddRange(new string[] { "Value" }); // Specify the template's series view. chart.SeriesTemplate.View = new SideBySideBarSeriesView(); // Specify the BoundDataChanged event handler. chart.BoundDataChanged += new BoundDataChangedEventHandler(chart_BoundDataChanged); // Specify the template's name prefix. chart.SeriesNameTemplate.BeginText = "Month: "; // Dock the chart into its parent, and add it to the current form. chart.Dock = DockStyle.Fill; this.Controls.Add(chart); } private void chart_BoundDataChanged(object sender, EventArgs e) { ChartControl chart = (ChartControl)sender; // Change the view of the "Month: Feb" series from // SideBySideBarSeriesView to LineSeriesView. Series feb = chart.GetSeriesByName("Month: Feb"); if(feb != null) feb.ChangeView(ViewType.Line); // Change the view of the "Month: March" series from // SideBySideBarSeriesView to SplineSeriesView. Series march = chart.GetSeriesByName("Month: March"); if(march != null) march.ChangeView(ViewType.Spline); } | |
| Visual Basic |  复制代码 复制代码 |
|---|---|
Imports System Imports System.Data Imports System.Windows.Forms Imports DevExpress.XtraCharts ' ... Private Function CreateChartData() As DataTable ' Create an empty table. Dim table As New DataTable("Table1") ' Add three columns to the table. table.Columns.Add("Month", GetType(String)) table.Columns.Add("Section", GetType(String)) table.Columns.Add("Value", GetType(Int32)) ' Add data rows to the table. table.Rows.Add(New Object() { "Jan", "Section1", 10 }) table.Rows.Add(New Object() { "Jan", "Section2", 20 }) table.Rows.Add(New Object() { "Jan", "Section3", 40 }) table.Rows.Add(New Object() { "Feb", "Section1", 20 }) table.Rows.Add(New Object() { "Feb", "Section2", 30 }) table.Rows.Add(New Object() { "Feb", "Section3", 80 }) table.Rows.Add(New Object() { "March", "Section1", 30 }) table.Rows.Add(New Object() { "March", "Section2", 40 }) table.Rows.Add(New Object() { "March", "Section3", 100 }) Return table End Function Private Sub Form1_Load(ByVal sender As Object, ByVal e As EventArgs) Handles MyBase.Load ' Create a chart. Dim chart As New ChartControl() ' Generate a data table and bind the chart to it. chart.DataSource = CreateChartData() ' Specify data members to bind the chart's series template. chart.SeriesDataMember = "Month" chart.SeriesTemplate.ArgumentDataMember = "Section" chart.SeriesTemplate.ValueDataMembers.AddRange(New String() { "Value" }) ' Specify the template's series view. chart.SeriesTemplate.View = New SideBySideBarSeriesView() ' Specify the BoundDataChanged event handler. AddHandler chart.BoundDataChanged, AddressOf chart_BoundDataChanged ' Specify the template's name prefix. chart.SeriesNameTemplate.BeginText = "Month: " ' Dock the chart into its parent, and add it to the current form. chart.Dock = DockStyle.Fill Me.Controls.Add(chart) End Sub Private Sub chart_BoundDataChanged(ByVal sender As Object, ByVal e As EventArgs) Dim chart As ChartControl = CType(sender, ChartControl) ' Change the view of the "Month: Feb" series from ' SideBySideBarSeriesView to LineSeriesView. Dim feb As Series = chart.GetSeriesByName("Month: Feb") If feb IsNot Nothing Then feb.ChangeView(ViewType.Line) End If ' Change the view of the "Month: March" series from ' SideBySideBarSeriesView to SplineSeriesView. Dim march As Series = chart.GetSeriesByName("Month: March") If march IsNot Nothing Then march.ChangeView(ViewType.Spline) End If End Sub | |
在下面的插图中显示了结果。

 Show Me Show Me |
|---|
在 DevExpress Code Central 数据库中可以找到完整的示例项目,网址是 http://www.devexpress.com/example=E1518。 取决于目标平台类型 (ASP.NET、WinForms 等),可以在线运行本示例,或者下载自动可执行的示例。 |


