 简要说明
简要说明
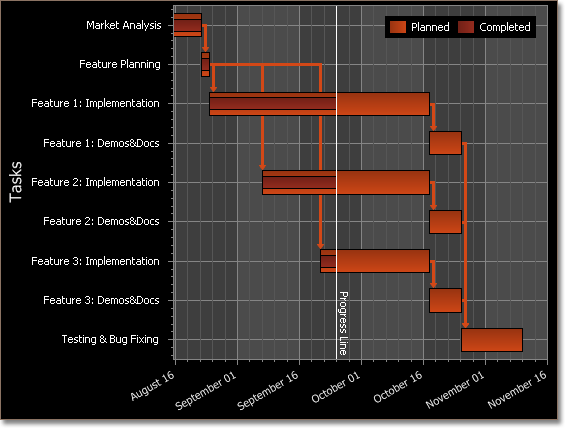
交叠甘特图 是由 OverlappedGanttSeriesView 对象来表示的,此对象属于 甘特系列视图 (也称为时间或时间线图表)。 这种视图沿时间轴显示水平条形。 每个条形表示一个有起始值和终值的独立事件,因此这些图表被用于跟踪在时间框架期间的不同行为 (例如在项目管理中计划多种资源的利用、检查项目的完成情况等)。 当需要从上至下逐个显示来源于不同系列的行动条形、并比较其持续期间时,使用这种图表类型。
 注意 注意 |
|---|
要学习如何从轴刻度中去除周末和节假日,请参阅 日期时间数据呈现。 |
在下面的插图中显示了一个交叠甘特图。

注意,对于甘特图,水平显示日期时间轴 (取值轴) 是公认的,因此不能旋转甘特图。 这就是 GanttDiagram.Rotated 属性 (属于 GanttDiagram 对象) 被隐藏和不可用的原因。
 图表类型特征
下表列出了这种图表类型的主要特征。
|
特征 |
取值 |
|---|---|
| 系列视图类型 | OverlappedGanttSeriesView |
| 图象类型 | 2D- GanttDiagram |
| 每个数据点的参数个数 | 1 |
| 每个数据点的取值个数 | 2 个日期时间值 (开始日期和结束日期) |
 注意 注意 |
|---|
要获得关于哪些图表类型可以与 交叠甘特图 组合使用的信息,请参阅 组合使用不同的系列视图 文档。 |
 示例
示例
关于在设计时刻如何创建甘特图的示例,请参阅 如何: 创建有任务链路的甘特图。
下面的示例演示了在运行时刻如何创建 ChartControl (拥有两个 OverlappedGanttSeriesView 类型的系列),并把图表添加到窗体中。 在继续本示例之前,首先要在 Visual Studio 中创建一个 Windows 窗体应用程序,并把所有 必需的程序集 包含到项目的“引用”列表中。
然后,把下列代码添加到 Form.Load 事件处理程序。
| C# |  复制代码 复制代码 |
|---|---|
using System; using System.Windows.Forms; using DevExpress.XtraCharts; // ... private void Form1_Load(object sender, EventArgs e) { // Create a new chart. ChartControl overlappedGanttChart = new ChartControl(); // Create two Gantt series. Series series1 = new Series("Planned", ViewType.Gantt); Series series2 = new Series("Completed", ViewType.Gantt); // Set the date-time values scale type for both series, // as it is qualitative, by default. series1.ValueScaleType = ScaleType.DateTime; series2.ValueScaleType = ScaleType.DateTime; // Add points to them. series1.Points.Add(new SeriesPoint("Market analysis", new DateTime[] { new DateTime(2006, 8, 16), new DateTime(2006, 8, 23) })); series1.Points.Add(new SeriesPoint("Feature planning", new DateTime[] { new DateTime(2006, 8, 23), new DateTime(2006, 8, 26) })); series1.Points.Add(new SeriesPoint("Implementation", new DateTime[] { new DateTime(2006, 8, 26), new DateTime(2006, 9, 26) })); series1.Points.Add(new SeriesPoint("Testing & bug fixing", new DateTime[] { new DateTime(2006, 9, 26), new DateTime(2006, 10, 10) })); series2.Points.Add(new SeriesPoint("Market analysis", new DateTime[] { new DateTime(2006, 8, 16), new DateTime(2006, 8, 23) })); series2.Points.Add(new SeriesPoint("Feature planning", new DateTime[] { new DateTime(2006, 8, 23), new DateTime(2006, 8, 26) })); series2.Points.Add(new SeriesPoint("Implementation", new DateTime[] { new DateTime(2006, 8, 26), new DateTime(2006, 9, 10) })); // Add both series to the chart. overlappedGanttChart.Series.AddRange(new Series[] { series1, series2 }); // Hide labels of both series. series1.Label.Visible = false; series2.Label.Visible = false; // Access the view-type-specific options of the series. ((GanttSeriesView)series1.View).BarWidth = 0.6; ((GanttSeriesView)series2.View).BarWidth = 0.3; // Access the type-specific options of the diagram. GanttDiagram myDiagram = (GanttDiagram)overlappedGanttChart.Diagram; myDiagram.AxisY.Interlaced = true; myDiagram.AxisY.GridSpacing = 10; myDiagram.AxisY.Label.Angle = -30; myDiagram.AxisY.Label.Antialiasing = true; myDiagram.AxisY.DateTimeOptions.Format = DateTimeFormat.MonthAndDay; // Add task links for the first Gantt series. ((GanttSeriesView)series1.View).LinkOptions.ArrowHeight = 7; ((GanttSeriesView)series1.View).LinkOptions.ArrowWidth = 11; for (int i = 1; i < series1.Points.Count; i++) { series1.Points[i].Relations.Add(series1.Points[i - 1]); } // Add a progress line. ConstantLine progress = new ConstantLine("Current progress", new DateTime(2006, 9, 10)); progress.ShowInLegend = false; progress.Title.Alignment = ConstantLineTitleAlignment.Far; myDiagram.AxisY.ConstantLines.Add(progress); // Adjust the legend. overlappedGanttChart.Legend.AlignmentHorizontal = LegendAlignmentHorizontal.Right; // Add a title to the chart (if necessary). overlappedGanttChart.Titles.Add(new ChartTitle()); overlappedGanttChart.Titles[0].Text = "R&D Schedule"; // Add the chart to the form. overlappedGanttChart.Dock = DockStyle.Fill; this.Controls.Add(overlappedGanttChart); } | |
| Visual Basic |  复制代码 复制代码 |
|---|---|
Imports System Imports System.Windows.Forms Imports DevExpress.XtraCharts ' ... Private Sub Form1_Load(ByVal sender As Object, _ ByVal e As EventArgs) Handles MyBase.Load ' Create a new chart. Dim overlappedGanttChart As New ChartControl() ' Create two Gantt series. Dim series1 As New Series("Planned", ViewType.Gantt) Dim series2 As New Series("Completed", ViewType.Gantt) ' Set the date-time values scale type for both series, ' as it is qualitative, by default. series1.ValueScaleType = ScaleType.DateTime series2.ValueScaleType = ScaleType.DateTime ' Add points to them. series1.Points.Add(New SeriesPoint("Market analysis", _ New DateTime() { New DateTime(2006, 8, 16), New DateTime(2006, 8, 23) })) series1.Points.Add(New SeriesPoint("Feature planning", _ New DateTime() { New DateTime(2006, 8, 23), New DateTime(2006, 8, 26) })) series1.Points.Add(New SeriesPoint("Implementation", _ New DateTime() { New DateTime(2006, 8, 26), New DateTime(2006, 9, 26) })) series1.Points.Add(New SeriesPoint("Testing & bug fixing", _ New DateTime() { New DateTime(2006, 9, 26), New DateTime(2006, 10, 10) })) series2.Points.Add(New SeriesPoint("Market analysis", _ New DateTime() { New DateTime(2006, 8, 16), New DateTime(2006, 8, 23) })) series2.Points.Add(New SeriesPoint("Feature planning", _ New DateTime() { New DateTime(2006, 8, 23), New DateTime(2006, 8, 26) })) series2.Points.Add(New SeriesPoint("Implementation", _ New DateTime() { New DateTime(2006, 8, 26), New DateTime(2006, 9, 10) })) ' Add both series to the chart. overlappedGanttChart.Series.AddRange(New Series() { series1, series2 }) ' Hide labels of both series. series1.Label.Visible = False series2.Label.Visible = False ' Access the view-type-specific options of the series. CType(series1.View, GanttSeriesView).BarWidth = 0.6 CType(series2.View, GanttSeriesView).BarWidth = 0.3 ' Access the type-specific options of the diagram. Dim myDiagram As GanttDiagram = CType(overlappedGanttChart.Diagram, GanttDiagram) myDiagram.AxisY.Interlaced = True myDiagram.AxisY.GridSpacing = 10 myDiagram.AxisY.Label.Angle = -30 myDiagram.AxisY.Label.Antialiasing = True myDiagram.AxisY.DateTimeOptions.Format = DateTimeFormat.MonthAndDay ' Add task links for the first Gantt series. CType(series1.View, GanttSeriesView).LinkOptions.ArrowHeight = 7 CType(series1.View, GanttSeriesView).LinkOptions.ArrowWidth = 11 For i As Integer = 1 To series1.Points.Count - 1 series1.Points(i).Relations.Add(series1.Points(i - 1)) Next i ' Add a progress line. Dim progress As New ConstantLine("Current progress", New DateTime(2006, 9, 10)) progress.ShowInLegend = False progress.Title.Alignment = ConstantLineTitleAlignment.Far myDiagram.AxisY.ConstantLines.Add(progress) ' Adjust the legend. overlappedGanttChart.Legend.AlignmentHorizontal = LegendAlignmentHorizontal.Right ' Add a title to the chart (if necessary). overlappedGanttChart.Titles.Add(New ChartTitle()) overlappedGanttChart.Titles(0).Text = "R&D Schedule" ' Add the chart to the form. overlappedGanttChart.Dock = DockStyle.Fill Me.Controls.Add(overlappedGanttChart) End Sub | |
 Show Me Show Me |
|---|
在 DevExpress Code Central 数据库中可以找到完整的示例项目,网址是 http://www.devexpress.com/example=E1218。 取决于目标平台类型 (ASP.NET、WinForms 等),可以在线运行本示例,或者下载自动可执行的示例。 |


