 简要说明
简要说明
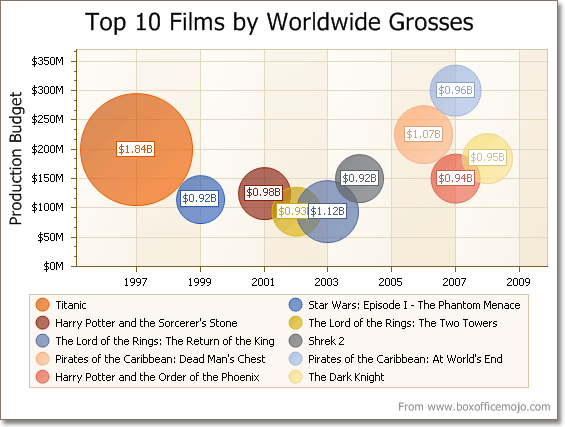
气泡图 是由 BubbleSeriesView 对象来表示的,此对象属于 点系列视图。 这种视图,除了其他点图象功能之外,还允许可视地呈现有第三个量度 (即所谓的系列点权重 BubbleLabelValueToDisplay.Weight,表示气泡的大小) 的数据。 沿通常的 X 轴和 Y 轴映射两个量度,然后在数据点上把第三个量度显示为一个形状 (一个填充圆 —— “气泡”、或一个星形、三角形等)。 也可以通过使用系列视图的 BubbleSeriesView.MaxSize 和 BubbleSeriesView.MinSize 属性,来为图表标记指定最小尺寸和最大尺寸。
在下面的插图中显示了一个气泡图示例。 注意,这种图表类型基于 XYDiagram,因此可以被翻转,从而改变轴的位置。

 图表类型特征
下表列出了这种图表类型的主要特征。
|
特征 |
取值 |
|---|---|
| 系列视图类型 | BubbleSeriesView |
| 图象类型 | 2D- XYDiagram |
| 每个数据点的参数个数 | 1 |
| 每个数据点的取值个数 | 2 (取值和权重) |
 注意 注意 |
|---|
要获得关于哪些图表类型可以与 气泡图 组合使用的信息,请参阅 组合使用不同的系列视图 文档。 |
 示例
示例
下面的示例演示了在运行时刻如何创建 ChartControl (拥有两个 BubbleSeriesView 类型的系列),并把图表添加到窗体中。 在继续本示例之前,首先要在 Visual Studio 中创建一个 Windows 窗体应用程序,并把所有 必需的程序集 包含到项目的“引用”列表中。
然后,把下列代码添加到 Form.Load 事件处理程序。
| C# |  复制代码 复制代码 |
|---|---|
using System; using System.Windows.Forms; using DevExpress.XtraCharts; // ... private void Form1_Load(object sender, EventArgs e) { // Create a new chart. ChartControl bubbleChart = new ChartControl(); // Create two bubble series. Series series1 = new Series("Series 1", ViewType.Bubble); Series series2 = new Series("Series 2", ViewType.Bubble); // Add points to them. series1.Points.Add(new SeriesPoint(1, 11, 2)); series1.Points.Add(new SeriesPoint(2, 10, 1)); series1.Points.Add(new SeriesPoint(3, 14, 3)); series1.Points.Add(new SeriesPoint(4, 17, 2)); series2.Points.Add(new SeriesPoint(1, 15, 3)); series2.Points.Add(new SeriesPoint(2, 18, 4)); series2.Points.Add(new SeriesPoint(3, 25, 2)); series2.Points.Add(new SeriesPoint(4, 33, 1)); // Add both series to the chart. bubbleChart.Series.AddRange(new Series[] { series1, series2 }); // Set the numerical argument scale types for the series, // as it is qualitative, by default. series1.ArgumentScaleType = ScaleType.Numerical; series2.ArgumentScaleType = ScaleType.Numerical; // Access the view-type-specific options of the series. ((BubbleSeriesView)series1.View).MaxSize = 2; ((BubbleSeriesView)series1.View).MinSize = 1; ((BubbleSeriesView)series1.View).BubbleMarkerOptions.Kind = MarkerKind.Circle; // Access the type-specific options of the diagram. ((XYDiagram)bubbleChart.Diagram).EnableAxisXZooming = true; // Hide the legend (if necessary). bubbleChart.Legend.Visible = false; // Add the chart to the form. bubbleChart.Dock = DockStyle.Fill; this.Controls.Add(bubbleChart); } | |
| Visual Basic |  复制代码 复制代码 |
|---|---|
Imports System Imports System.Windows.Forms Imports DevExpress.XtraCharts ' ... Private Sub Form1_Load(ByVal sender As Object, ByVal e As EventArgs) _ Handles MyBase.Load ' Create a new chart. Dim bubbleChart As New ChartControl() ' Create two bubble series. Dim series1 As New Series("Series 1", ViewType.Bubble) Dim series2 As New Series("Series 2", ViewType.Bubble) ' Add points to them. series1.Points.Add(New SeriesPoint(1, 11, 2)) series1.Points.Add(New SeriesPoint(2, 10, 1)) series1.Points.Add(New SeriesPoint(3, 14, 3)) series1.Points.Add(New SeriesPoint(4, 17, 2)) series2.Points.Add(New SeriesPoint(1, 15, 3)) series2.Points.Add(New SeriesPoint(2, 18, 4)) series2.Points.Add(New SeriesPoint(3, 25, 2)) series2.Points.Add(New SeriesPoint(4, 33, 1)) ' Add both series to the chart. bubbleChart.Series.AddRange(New Series() { series1, series2 }) ' Set the numerical argument scale types for the series, ' as it is qualitative, by default. series1.ArgumentScaleType = ScaleType.Numerical series2.ArgumentScaleType = ScaleType.Numerical ' Access the view-type-specific options of the series. CType(series1.View, BubbleSeriesView).MaxSize = 2 CType(series1.View, BubbleSeriesView).MinSize = 1 CType(series1.View, BubbleSeriesView).BubbleMarkerOptions.Kind = MarkerKind.Circle ' Access the type-specific options of the diagram. CType(bubbleChart.Diagram, XYDiagram).EnableAxisXZooming = True ' Hide the legend (if necessary). bubbleChart.Legend.Visible = False ' Add the chart to the form. bubbleChart.Dock = DockStyle.Fill Me.Controls.Add(bubbleChart) End Sub | |
 Show Me Show Me |
|---|
在 DevExpress Code Central 数据库中可以找到完整的示例项目,网址是 http://www.devexpress.com/example=E904。 取决于目标平台类型 (ASP.NET、WinForms 等),可以在线运行本示例,或者下载自动可执行的示例。 |


