


本示例演示了在运行时刻如何创建并定制 数值带。
因为数值带位于对应 轴 的数值带集合中,因此首先应把 图象 对象转换为所需的图象类型。 此后,就可以通过 Axis2D.Strips 属性来访问数值带集合。
| C# |  复制代码 复制代码 |
|---|---|
// Cast the chart's diagram to the XYDiagram type, to access its axes. XYDiagram diagram = (XYDiagram)chartControl1.Diagram; // Create a strip with its maximum and minimum axis value defined. diagram.AxisY.Strips.Add(new Strip("Strip 1", 5, 15)); // Customize the strip's behavior. diagram.AxisY.Strips[0].Visible = true; diagram.AxisY.Strips[0].ShowAxisLabel = true; diagram.AxisY.Strips[0].AxisLabelText = "My Range"; diagram.AxisY.Strips[0].ShowInLegend = true; diagram.AxisY.Strips[0].LegendText = "A Sample Strip"; // Customize the strip's appearance. diagram.AxisY.Strips[0].Color = Color.CornflowerBlue; diagram.AxisY.Strips[0].FillStyle.FillMode = FillMode.Empty; | |
| Visual Basic | 复制代码 |
|---|---|
' Cast the chart's diagram to the XYDiagram type, to access its axes. Dim diagram As XYDiagram = CType(chartControl1.Diagram, XYDiagram) ' Create a strip with its maximum and minimum axis value defined. diagram.AxisY.Strips.Add(new Strip("Strip 1", 5, 15)) ' Customize the strip's behavior. diagram.AxisY.Strips(0).Visible = True diagram.AxisY.Strips(0).ShowAxisLabel = True diagram.AxisY.Strips(0).AxisLabelText = "My Range" diagram.AxisY.Strips(0).ShowInLegend = True diagram.AxisY.Strips(0).LegendText = "A Sample Strip" ' Customize the strip's appearance. diagram.AxisY.Strips(0).Color = Color.CornflowerBlue diagram.AxisY.Strips(0).FillStyle.FillMode = FillMode.Empty | |
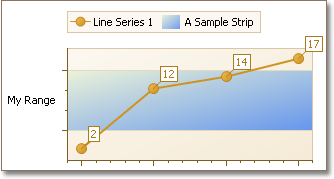
在下面的插图中显示了结果。
 Show Me Show Me |
|---|
在 DevExpress Code Central 数据库中可以找到完整的示例项目,网址是 http://www.devexpress.com/example=E1369。 取决于目标平台类型 (ASP.NET、WinForms 等),可以在线运行本示例,或者下载自动可执行的示例。 |
