本指南展示了当图表数据促成 (数据的较大值和较小值相差很大) 使用刻度分隔线时,如何通过 刻度分隔线 分割 轴范围。 要学习另一种可选的方式 —— 人工创建刻度分隔线,请参阅 如何: 人工把刻度分隔线插入到轴中 或 如何: 人工把刻度分隔线插入到轴中 (运行时刻示例)。
使用 XtraCharts,可以在需要时,允许图表通过刻度分隔线自动分割轴范围。 注意,自动创建的和人工创建的轴刻度分隔线可以共存,而不影响图表的输出,除非它们的范围冲突。
在设计时刻要启用自动刻度分隔线,则选中所需的 轴,展开它的 Axis.AutoScaleBreaks 属性,并把 AutoScaleBreaks.Enabled 属性设置为 true。

要指定自动刻度分隔线的最大数目,则使用 AutoScaleBreaks.MaxCount 属性。
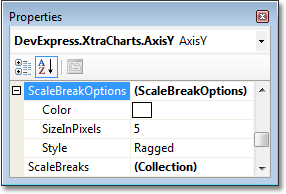
另外,还可以使用 Axis.ScaleBreakOptions 属性,来调整人工创建的和自动创建的刻度分隔线的 公共 外观。

使用下列代码在运行时刻启用自动 刻度分隔线。
| C# |  复制代码 复制代码 |
|---|---|
// Cast your diagram object to an appropriate diagram type, // to access its axes. XYDiagram diagram = (XYDiagram)chartControl1.Diagram; // Enable automatic scale breaks creation, // and define their maximum number. diagram.AxisY.AutoScaleBreaks.Enabled = true; diagram.AxisY.AutoScaleBreaks.MaxCount = 5; // Define the scale breaks' options, which are common // for both manual and automatic scale breaks. diagram.AxisY.ScaleBreakOptions.Style = ScaleBreakStyle.Waved; diagram.AxisY.ScaleBreakOptions.SizeInPixels = 30; diagram.AxisY.ScaleBreakOptions.Color = Color.Turquoise; | |
| Visual Basic |  复制代码 复制代码 |
|---|---|
' Cast your diagram object to an appropriate diagram type, ' to access its axes. Dim diagram As XYDiagram = CType(chartControl1.Diagram, XYDiagram) ' Enable automatic scale breaks creation, ' and define their maximum number. diagram.AxisY.AutoScaleBreaks.Enabled = True diagram.AxisY.AutoScaleBreaks.MaxCount = 5 ' Define the scale breaks' options, which are common ' for both manual and automatic scale breaks. diagram.AxisY.ScaleBreakOptions.Style = ScaleBreakStyle.Waved diagram.AxisY.ScaleBreakOptions.SizeInPixels = 30 diagram.AxisY.ScaleBreakOptions.Color = Color.Turquoise | |
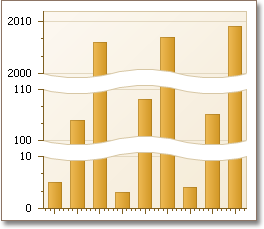
在下面的插图中显示了一个假定的结果。

 Show Me Show Me |
|---|
在 DevExpress Code Central 数据库中可以找到完整的示例项目,网址是 http://www.devexpress.com/example=E1621。 取决于目标平台类型 (ASP.NET、WinForms 等),可以在线运行本示例,或者下载自动可执行的示例。 |


