 Show Me Show Me |
|---|
在 DevExpress Code Central 数据库中可以找到完整的示例项目,网址是 http://www.devexpress.com/example=E2717。 取决于目标平台类型 (ASP.NET、WinForms 等),可以在线运行本示例,或者下载自动可执行的示例。 |
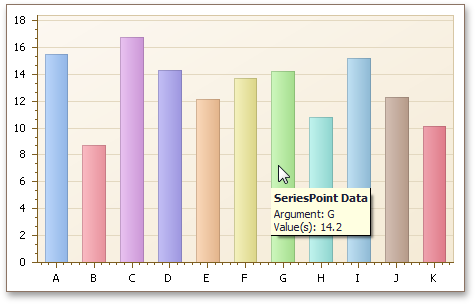
这个示例展示了如何接管 ChartControl.MouseMove 事件,从而确定哪个 系列点 位于测试点下面,并且使用 ToolTipController 在工具提示中显示它的参数和取值信息。
要在运行时刻启用点击测试,以便于让本示例正确工作,则把 ChartControl.RuntimeHitTesting 属性设置为 true。
| C# |  复制代码 复制代码 |
|---|---|
(Form1.cs) using System; using System.Windows.Forms; using DevExpress.XtraCharts; // ... private void chartControl1_MouseMove(object sender, MouseEventArgs e) { // Obtain hit information under the test point. ChartHitInfo hi = chartControl1.CalcHitInfo(e.X, e.Y); // Obtain the series point under the test point. SeriesPoint point = hi.SeriesPoint; // Check whether the series point was clicked or not. if (point != null) { // Obtain the series point argument. string argument = "Argument: " + point.Argument.ToString(); // Obtain series point values. string values = "Value(s): " + point.Values[0].ToString(); if (point.Values.Length > 1) { for (int i = 1; i < point.Values.Length; i++) { values = values + ", " + point.Values[i].ToString(); } } // Show the tooltip. toolTipController1.ShowHint(argument + "\n" + values, "SeriesPoint Data"); } else { // Hide the tooltip. toolTipController1.HideHint(); } } | |
| Visual Basic |  复制代码 复制代码 |
|---|---|
(Form1.vb) Imports System Imports System.Windows.Forms Imports DevExpress.XtraCharts ' ... Private Sub chartControl1_MouseMove(ByVal sender As Object, ByVal e As MouseEventArgs) Handles chartControl1.MouseMove ' Obtain hit information under the test point. Dim hi As ChartHitInfo = chartControl1.CalcHitInfo(e.X, e.Y) ' Obtain the series point under the test point. Dim point As SeriesPoint = hi.SeriesPoint ' Check whether the series point was clicked or not. If point IsNot Nothing Then ' Obtain the series point argument. Dim argument As String = "Argument: " & point.Argument.ToString() ' Obtain series point values. Dim values As String = "Value(s): " & point.Values(0).ToString() If point.Values.Length > 1 Then For i As Integer = 1 To point.Values.Length - 1 values = values & ", " & point.Values(i).ToString() Next i End If ' Show the tooltip. toolTipController1.ShowHint(argument & Constants.vbLf & values, "SeriesPoint Data") Else ' Hide the tooltip. toolTipController1.HideHint() End If End Sub | |
不能使用 ChartControl.HitTest 方法来实现此目的,因为此方法返回鼠标单击的 ChartElement (图表元素)。 SeriesPoint (系列点) 对象不是图表元素,而 Series、XYDiagram 和 ChartControl 对象都是图表元素。
在下面的插图中显示了结果。


