| C# |  复制代码 复制代码 |
|---|---|
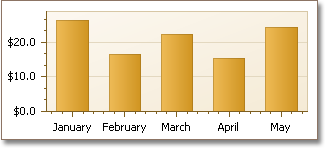
using System; using System.Windows.Forms; using DevExpress.XtraCharts; // ... private void Form1_Load(object sender, EventArgs e) { // Create an empty chart. ChartControl chartControl1 = new ChartControl(); // Create a bar series and add points to it. Series series1 = new Series("Series 1", ViewType.Bar); series1.Points.Add(new SeriesPoint(new DateTime(2009, 1, 1), new double[] { 26.25 })); series1.Points.Add(new SeriesPoint(new DateTime(2009, 2, 1), new double[] { 16.52 })); series1.Points.Add(new SeriesPoint(new DateTime(2009, 3, 1), new double[] { 22.21 })); series1.Points.Add(new SeriesPoint(new DateTime(2009, 4, 1), new double[] { 15.35 })); series1.Points.Add(new SeriesPoint(new DateTime(2009, 5, 1), new double[] { 24.15 })); // Add the series to the chart. chartControl1.Series.Add(series1); // Hide the legend and series labels (if necessary). chartControl1.Legend.Visible = false; series1.Label.Visible = false; // Set the scale type for the series' arguments and values. series1.ArgumentScaleType = ScaleType.DateTime; series1.ValueScaleType = ScaleType.Numerical; // Cast the chart's diagram to the XYDiagram type, to access its axes. XYDiagram diagram = (XYDiagram)chartControl1.Diagram; // Define the date-time measurement unit, to which the beginning of // a diagram's gridlines and labels should be aligned. diagram.AxisX.DateTimeGridAlignment = DateTimeMeasurementUnit.Day; // Define the detail level for date-time values. diagram.AxisX.DateTimeMeasureUnit = DateTimeMeasurementUnit.Month; // Define the custom date-time format (name of a month) for the axis labels. diagram.AxisX.DateTimeOptions.Format = DateTimeFormat.Custom; diagram.AxisX.DateTimeOptions.FormatString = "MMMM"; // Since the ValueScaleType of the chart's series is Numerical, // it is possible to customize the NumericOptions of Y-axis. diagram.AxisY.NumericOptions.Format = NumericFormat.Currency; diagram.AxisY.NumericOptions.Precision = 1; // Add the chart to the form. chartControl1.Dock = DockStyle.Fill; this.Controls.Add(chartControl1); } | |
| Visual Basic |  复制代码 复制代码 |
|---|---|
Imports System Imports System.Windows.Forms Imports DevExpress.XtraCharts ' ... Private Sub Form1_Load(ByVal sender As Object, ByVal e As EventArgs) Handles MyBase.Load ' Create an empty chart. Dim chartControl1 As New ChartControl() ' Create a bar series and add points to it. Dim series1 As New Series("Series 1", ViewType.Bar) series1.Points.Add(New SeriesPoint(New DateTime(2009, 1, 1), New Double() { 26.25 })) series1.Points.Add(New SeriesPoint(New DateTime(2009, 2, 1), New Double() { 16.52 })) series1.Points.Add(New SeriesPoint(New DateTime(2009, 3, 1), New Double() { 22.21 })) series1.Points.Add(New SeriesPoint(New DateTime(2009, 4, 1), New Double() { 15.35 })) series1.Points.Add(New SeriesPoint(New DateTime(2009, 5, 1), New Double() { 24.15 })) ' Add the series to the chart. chartControl1.Series.Add(series1) ' Hide the legend and series labels (if necessary). chartControl1.Legend.Visible = False series1.Label.Visible = False ' Set the scale type for the series' arguments and values. series1.ArgumentScaleType = ScaleType.DateTime series1.ValueScaleType = ScaleType.Numerical ' Cast the chart's diagram to the XYDiagram type, to access its axes. Dim diagram As XYDiagram = CType(chartControl1.Diagram, XYDiagram) ' Define the date-time measurement unit, to which the beginning of ' a diagram's gridlines and labels should be aligned. diagram.AxisX.DateTimeGridAlignment = DateTimeMeasurementUnit.Day ' Define the detail level for date-time values. diagram.AxisX.DateTimeMeasureUnit = DateTimeMeasurementUnit.Month ' Define the custom date-time format (name of a month) for the axis labels. diagram.AxisX.DateTimeOptions.Format = DateTimeFormat.Custom diagram.AxisX.DateTimeOptions.FormatString = "MMMM" ' Since the ValueScaleType of the chart's series is Numerical, ' it is possible to customize the NumericOptions of Y-axis. diagram.AxisY.NumericOptions.Format = NumericFormat.Currency diagram.AxisY.NumericOptions.Precision = 1 ' Add the chart to the form. chartControl1.Dock = DockStyle.Fill Me.Controls.Add(chartControl1) End Sub | |
在下面的插图中显示了结果。

 Show Me Show Me |
|---|
在 DevExpress Code Central 数据库中可以找到完整的示例项目,网址是 http://www.devexpress.com/example=E1361。 取决于目标平台类型 (ASP.NET、WinForms 等),可以在线运行本示例,或者下载自动可执行的示例。 |


