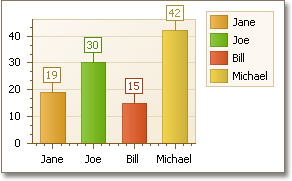
本指南演示了如何把图表绑定到以 ArrayList 对象表示的数据。
 Show Me Show Me |
|---|
在 DevExpress Code Central 数据库中可以找到完整的示例项目,网址是 http://www.devexpress.com/example=E2080。 取决于目标平台类型 (ASP.NET、WinForms 等),可以在线运行本示例,或者下载自动可执行的示例。 |
要把图表绑定到 ArrayList 对象,则执行下列操作。
-
启动 MS Visual Studio (2005、2008 或 2010),并且新建一个或者打开一个现有的 Windows 窗体应用程序。
-
声明一个表示单条记录的类。 下面的代码声明了一个类,该类有 ID、Name 和 Age 公共属性。 这些属性将成为数据源字段。
C#  复制代码
复制代码public class Record { int id, age; string name; public Record(int id, string name, int age) { this.id = id; this.name = name; this.age = age; } public int ID { get { return id; } set { id = value; } } public string Name { get { return name; } set { name = value; } } public int Age { get { return age; } set { age = value; } } }
Visual Basic  复制代码
复制代码Public Class Record Dim _id, _age As Integer Dim _name As String Public Sub New(ByVal id As Integer, ByVal name As String, ByVal age As Integer) Me._id = id Me._name = name Me._age = age End Sub Public Property ID() As Integer Get Return _id End Get Set(ByVal Value As Integer) _ID = Value End Set End Property Public Property Name() As String Get Return _name End Get Set(ByVal Value As String) _name = Value End Set End Property Public Property Age() As Integer Get Return _age End Get Set(ByVal Value As Integer) _age = Value End Set End Property End Class
-
在声明记录类之后,就可以使用记录填充数据源对象了。 本示例将使用一个 ArrayList 作为报表的数据源。 因此不需要创建实现 IList、ITypedList 或 IBindingList 接口的自定义对象。
下面的代码为 ArrayList 对象填充记录,并把它指派到图表的 ChartControl.DataSource 属性。 然后,就可以调整图表系列的 SeriesBase.ArgumentDataMember 和 SeriesBase.ValueDataMembers 属性。
C#  复制代码
复制代码private void Form1_Load(object sender, EventArgs e) { // Create a list. ArrayList listDataSource = new ArrayList(); // Populate the list with records. listDataSource.Add(new Record(1, "Jane", 19)); listDataSource.Add(new Record(2, "Joe", 30)); listDataSource.Add(new Record(3, "Bill", 15)); listDataSource.Add(new Record(4, "Michael", 42)); // Bind the chart to the list. ChartControl myChart = chartControl1; myChart.DataSource = listDataSource; // Create a series, and add it to the chart. Series series1 = new Series("My Series", ViewType.Bar); myChart.Series.Add(series1); // Adjust the series data members. series1.ArgumentDataMember = "name"; series1.ValueDataMembers.AddRange(new string[] { "age" }); // Access the view-type-specific options of the series. ((BarSeriesView)series1.View).ColorEach = true; series1.LegendPointOptions.Pattern = "{A}"; }
Visual Basic  复制代码
复制代码Private Sub Form1_Load(ByVal sender As Object, _ ByVal e As EventArgs) Handles MyBase.Load ' Create a list. Dim listDataSource As New ArrayList() ' Populate the list with records. listDataSource.Add(New Record(1, "Jane", 19)) listDataSource.Add(New Record(2, "Joe", 30)) listDataSource.Add(New Record(3, "Bill", 15)) listDataSource.Add(New Record(4, "Michael", 42)) ' Bind the chart to the list. Dim myChart As ChartControl = chartControl1 myChart.DataSource = listDataSource ' Create a series, and add it to the chart. Dim series1 As New Series("My Series", ViewType.Bar) myChart.Series.Add(series1) ' Adjust the series data members. series1.ArgumentDataMember = "name" series1.ValueDataMembers.AddRange(New String() { "age" }) ' Access the view-type-specific options of the series. CType(series1.View, BarSeriesView).ColorEach = True series1.LegendPointOptions.Pattern = "{A}" End Sub
现在,图表已经被绑定到数据。 运行此应用程序,并查看结果。


