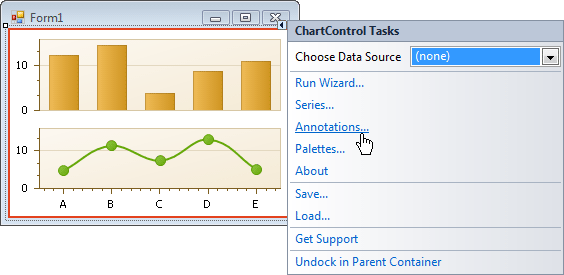
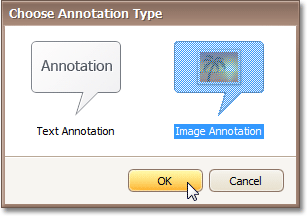
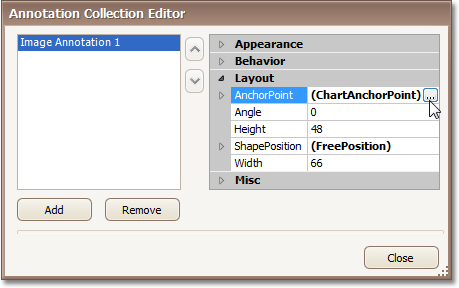
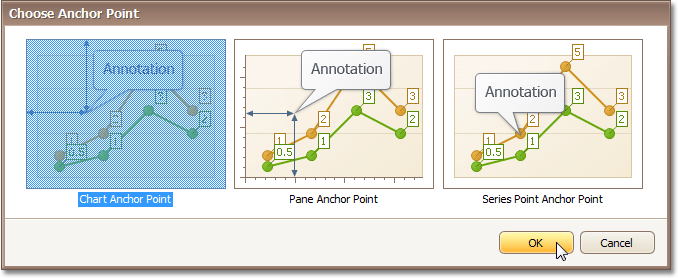
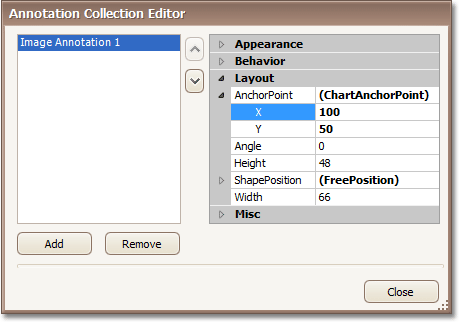
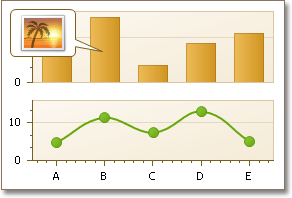
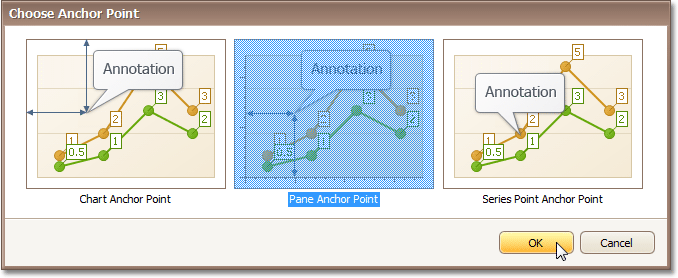
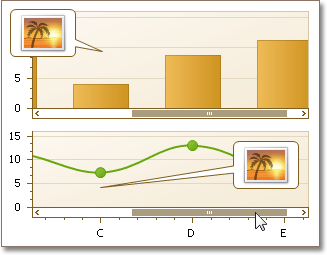
这个示例展示了如何创建两个图像批注 ―― 一个被锚定到图表 (通过指定两个以像素为单位的绝对坐标),另一个被锚定到窗格 (通过指定两个轴数值)。 要查看总说明,请参阅 批注。
 Show Me Show Me |
|---|
在 DevExpress Code Central 数据库中可以找到完整的示例项目,网址是 http://www.devexpress.com/example=E2188。 取决于目标平台类型 (ASP.NET、WinForms 等),可以在线运行本示例,或者下载自动可执行的示例。 |
为了展示如何完成此任务,我们使用类似于下列指南中所创建的图表: 课程 2 - 创建简单的非绑定图表。